Projects, Bankability and Development Priorities

Benissan Barrigah – edited by PACT
Infrastructure shapes a country’s economic possibilities and the daily lives of its people. Roads connect producers to markets, while reliable power enables firms to operate and invest. Ports and railways influence where industry develops and how local economies participate in regional trade. Schools, healthcare facilities and effective urban services support healthy and productive lives.
Across Africa, meeting these needs requires an estimated $130 billion to $170 billion in infrastructure investment each year, against a financing gap of $68 billion to $108 billion. Beyond these headline estimates lies a broader question: how is capital distributed within the observable project market, and what does that distribution reveal about the continent’s development priorities?
This article addresses that question through the Griot database, covering the period from the third quarter of 2025 to the second quarter of 2026. Based on a broad economic definition of infrastructure, the database contains more than 700 entries, spanning committed transactions and projects under development or announced. Together, these entries represent a potential aggregate value of approximately $400 billion. Coverage reflects the extent of publicly disclosed project information.
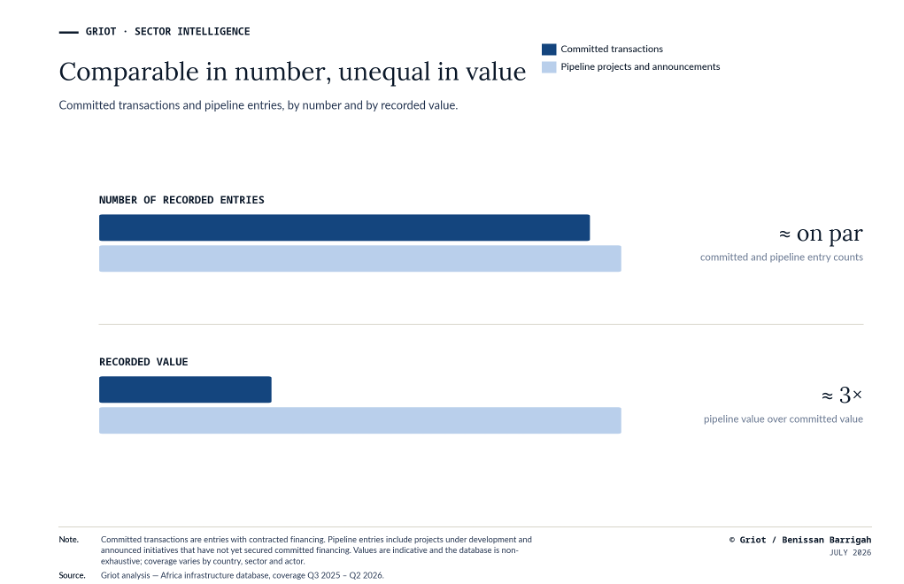
The analysis compares financing patterns across sectors and regions and examines the institutions involved throughout the project cycle. It reveals an active but uneven market, marked by wide differences in project maturity and institutional capacity. It also shows that the infrastructure most visible in transaction data does not always align with the areas of greatest development need.
Sector trends
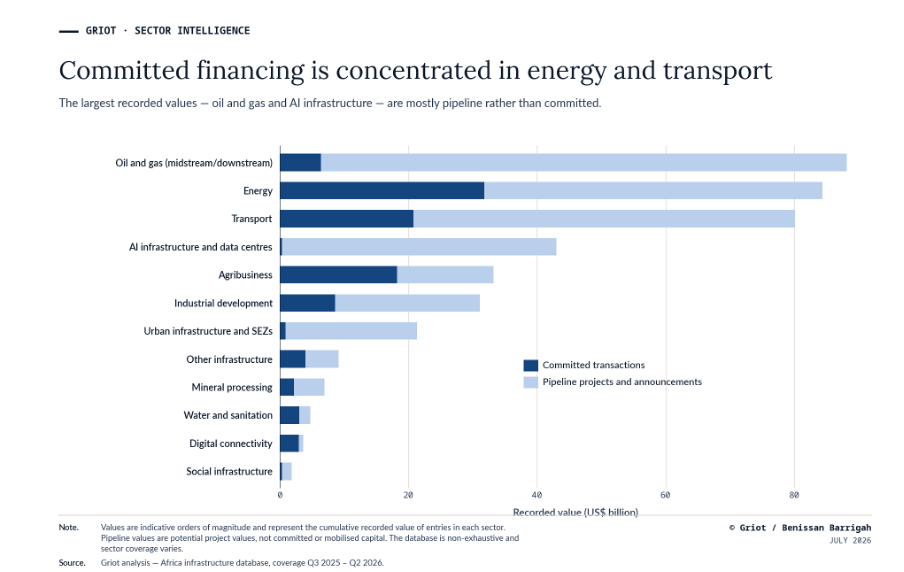
The sectoral breakdown reveals distinct financing profiles. Energy and transport have the largest bases of committed transactions. Much of the value recorded in oil and gas and digital infrastructure remains in projects under development or at the announcement stage. Water and social infrastructure are only lightly represented in the transaction data despite their economic importance.
Energy and transport: the largest bases of committed capital
Energy forms the largest segment of the observable market, both by transaction count and committed value. This position reflects the scale of electricity demand and the relative maturity of financing models, particularly those built around independent power producers and power purchase agreements.
Conversion of the energy pipeline still depends on the creditworthiness of offtakers and the ability of grids to absorb new generation. Tariff policy, guarantees and foreign-exchange exposure also affect whether projects reach financial close.
Transport also records substantial committed activity, although financing models vary by asset. Ports and railways can draw on identifiable trade flows; roads depend more heavily on public payment mechanisms or toll revenues.
The Abidjan–Lagos corridor illustrates the complexity of cross-border infrastructure. Delivery requires sustained coordination among participating states and a credible link between public commitments and the financing package. Regional governance therefore has a direct bearing on the project’s bankability.
Oil and gas: large projects remain in the pipeline
Midstream and downstream oil and gas account for a large recorded value, most of it still in the pipeline. Transport, storage and processing assets can draw on identified resource flows and relatively predictable commercial revenues. Large public or private sponsors also support their development.
The recorded value reflects the scale of the announced industrial projects. Conversion into committed transactions will depend on the economics of individual assets and prevailing international financing conditions.
AI infrastructure and data centres: an emerging market
AI infrastructure and data centres show a wide gap between announced project values and committed financing. The pipeline reflects growing interest in cloud services and computing capacity.
These assets require reliable electricity and high-capacity international connectivity. Their commercial viability also depends on customer demand sufficient to support recurring revenues. Market depth will become clearer as announcements convert into projects backed by identifiable customers and contracted revenues.
Productive infrastructure: retaining value in local economies
Agribusiness, industrial development and mineral processing encompass assets that connect resources with local production capacity. Their presence in the database points to interest in productive value chains, although project maturity varies widely.
Agribusiness volumes are heavily influenced by one exceptional project. Other recorded transactions largely concern irrigation, storage, cold-chain infrastructure and agri-food processing. Their viability depends on reliable buyers and consistent throughput.
In industry and mineral processing, the development question concerns the share of value retained locally. Critical minerals can support new processing facilities and higher-value production, while a large share of value is still captured after extraction.
Major corridors can broaden these effects. The Lobito Corridor is currently anchored by copper and cobalt flows from the Copperbelt. Its wider economic reach will depend on the industrial and agricultural activity developed along the route. Simandou raises a similar question: its local and regional effects will depend on the productive capacity built around the corridor. These assets will contribute more to development where they retain value in resource-producing economies and create economic activity along the routes they serve.
Water, connectivity and social infrastructure: limited visibility in the data
Water, sanitation, connectivity and social infrastructure account for smaller recorded values. Their limited presence may reflect smaller project sizes and less frequent disclosure of financial terms. It also reflects their reliance on public and concessional finance.
Digital connectivity can generally draw on identifiable commercial revenues. Water and sanitation depend more heavily on tariff policy and the financial capacity of public operators. Social infrastructure is financed mainly through sovereign budgets and development finance.
The benefits of these assets extend beyond the infrastructure itself and accrue over long periods, making them difficult to capture through direct financial returns. Their limited representation in the database primarily reflects their financing models and the lower visibility of their transactions; their development value is much broader than the transaction record suggests.
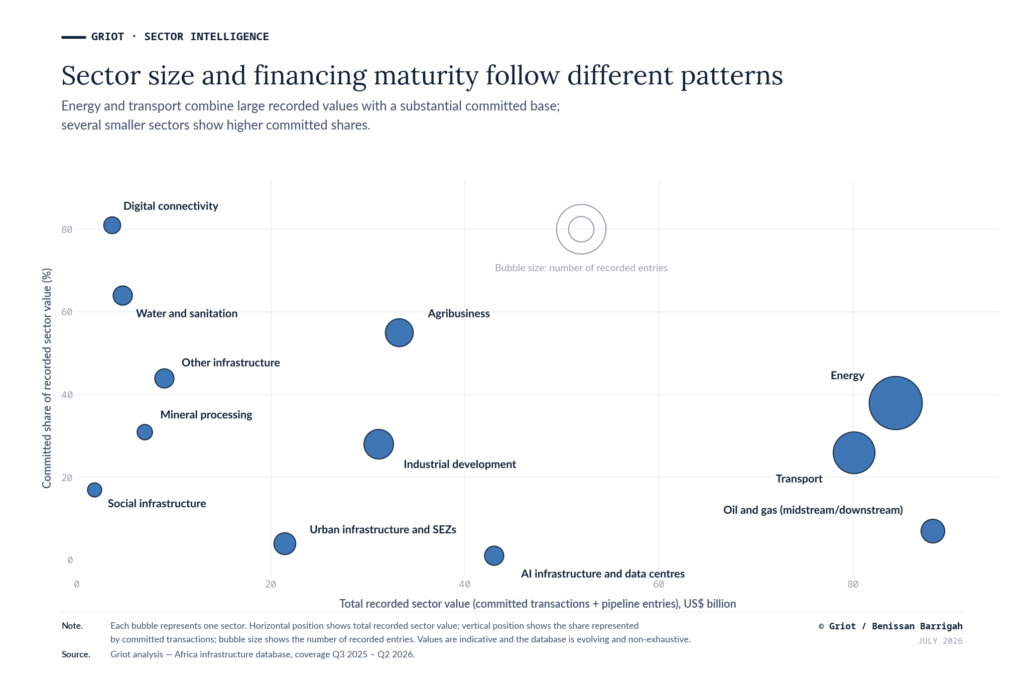
The sectoral picture reveals different levels of financial maturity. Infrastructure connects living conditions with productive activity and places substantial demands on sovereign capacity. Bankability measures an asset’s ability to secure financing. Development value captures its wider economic and human effects.
Regional analysis
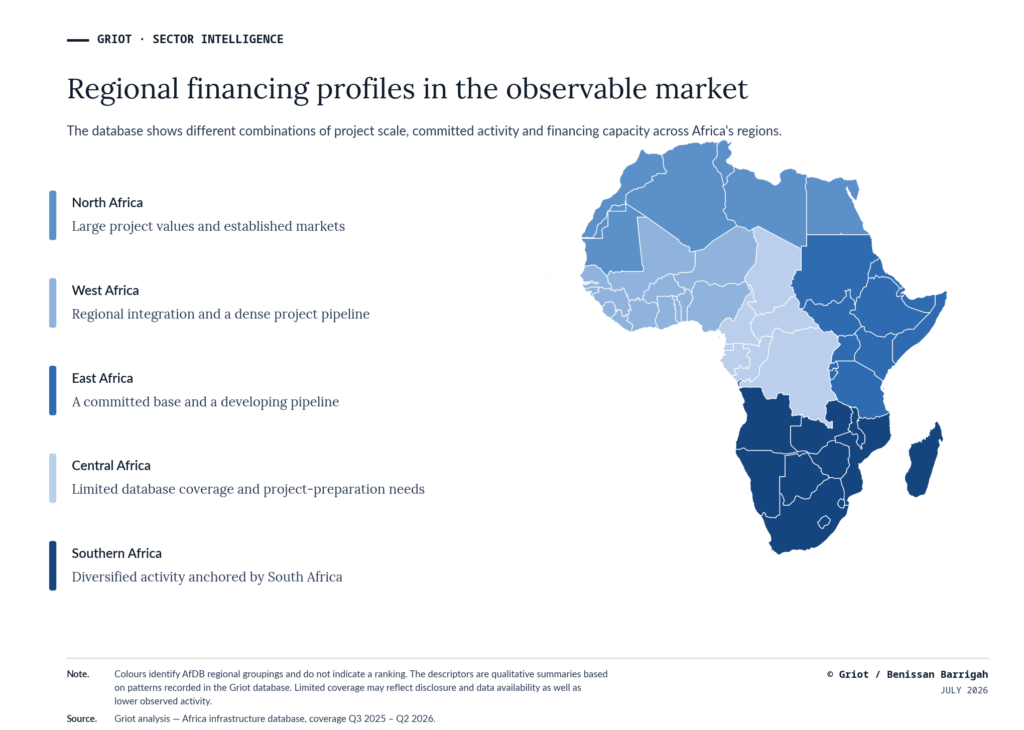
Projects appear in every region, but their progression from announcement to financing follows different paths. Some regions contain large project values still under development; others have a more diversified base of committed transactions. Lower recorded values may also reflect limited disclosure or weaker project-preparation capacity.
Distinct regional profiles
| Region | Main sectors in committed activity | Main pipeline sectors | Interpretation |
| North Africa | Agribusiness, transport, energy, water | AI infrastructure and data centres, energy, industrial development, midstream and downstream oil and gas, urban infrastructure and SEZs | Large projects dominate the observed profile. Committed activity is concentrated in water, energy and transport, while the pipeline is shifting towards industrial and digital assets and several urban projects. State institutions and large corporate groups drive much of the market. Progress will depend on converting announced projects into financed transactions. |
| Southern Africa | Energy, downstream oil and gas, industrial development, water, digital connectivity | Energy, midstream and downstream oil and gas, AI infrastructure and data centres, transport, mineral processing | The most diversified market in the sample. Activity spans energy, mining, industrial development, freight, water and digital assets. South Africa provides most of the region’s financial depth. The main constraint is extending financing and execution capacity to projects elsewhere in the region. |
| East Africa | Energy, transport, industrial development | Midstream and downstream oil and gas, transport, urban infrastructure and SEZs, industrial development | Committed activity is substantial but concentrated in a limited number of sectors, led by energy. The pipeline is shifting towards transport corridors, urban assets and selected downstream oil and gas projects. The emerging pattern combines logistics with industrial and urban development. |
| West Africa | Transport, energy, mineral processing, agribusiness | Midstream and downstream oil and gas, agribusiness, transport, energy | The highest project count in the database. Committed activity is concentrated in regional integration infrastructure and selected productive assets. The pipeline is led by downstream gas, transport corridors and agribusiness. Progress depends on converting the project base into financed transactions and completed assets. |
| Central Africa | Transport, water, digital connectivity, energy | Energy, transport, urban infrastructure and SEZs, industrial development | The region is underrepresented in the database. Committed transactions are concentrated in essential infrastructure, while the pipeline points to a broader range of opportunities. Stronger project preparation and structuring would improve the ability of corridor, energy and resource-linked assets to secure financing. |
The regional distribution of projects reveals uneven financing and project-structuring capacity. Established markets need to extend existing expertise beyond their current centres of activity. Other regions require stronger project preparation and financing mechanisms suited to cross-border transactions. The pipeline therefore provides an indication of how effectively economies and public institutions convert infrastructure needs into deliverable projects.
Southern Africa — Sectoral diversity and South Africa’s financial depth
Southern Africa has the most diversified transaction base in the sample, although financial activity remains concentrated in South Africa. Energy leads committed activity, followed by downstream oil and gas, industrial development and water. Energy and gas also feature prominently in the pipeline, alongside a larger share of data centres and transport. The regional profile combines an established base of financed assets with newer categories still being structured.
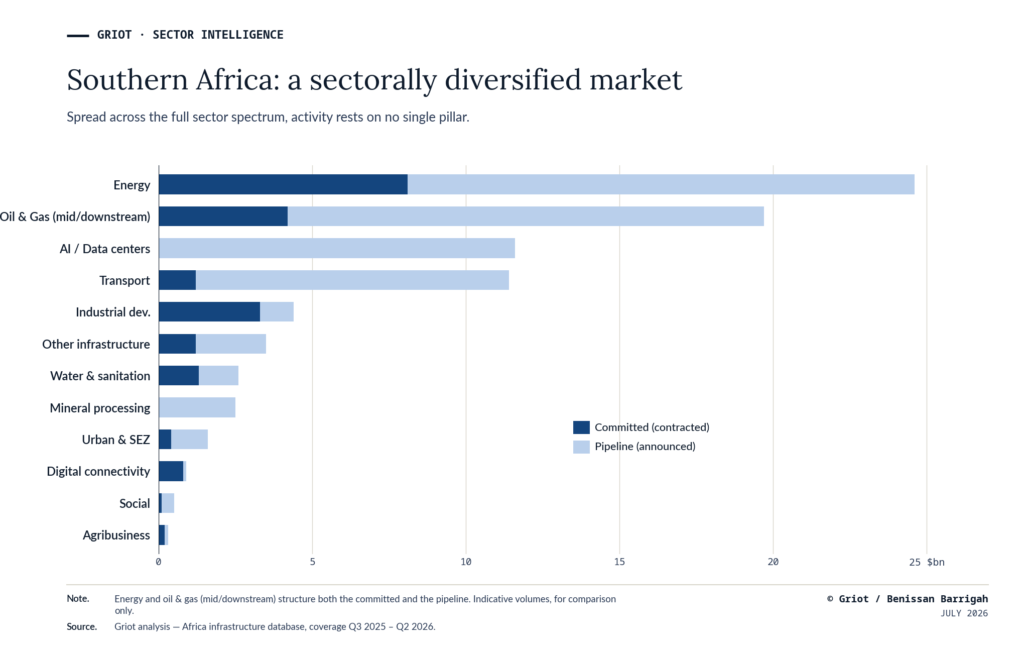
Several projects benefit from identifiable revenue streams and established counterparties. Power purchase agreements and cash flows from industrial activity make expected revenues easier to assess.
South Africa has a deeper financial and contractual ecosystem than neighbouring markets. Reforms in electricity and logistics are strengthening this advantage. Several countries elsewhere in the region continue to face more limited project-preparation capacity.
The region’s trajectory will depend on extending these capabilities beyond South Africa so that its domestic financial depth can support more projects in neighbouring countries.
West Africa — Regional integration and a dense project pipeline
West Africa records the largest number of transactions in the sample, although a small number of large projects account for much of the value. Transport represents the largest share of committed activity, alongside energy, mineral processing and agribusiness. The pipeline is led by midstream and downstream oil and gas, with a substantial agribusiness component. The region combines a dense project base with a large value of assets still being structured.
Regional integration shapes the market. Power interconnections, logistics corridors and gas networks connect fragmented national markets. Delivery requires sustained coordination among states, operators and financiers. The Nigeria–Morocco Gas Pipeline illustrates this complexity: implementation depends on final institutional agreements and a viable commercial and financing structure. Recent official statements continue to call for faster implementation.
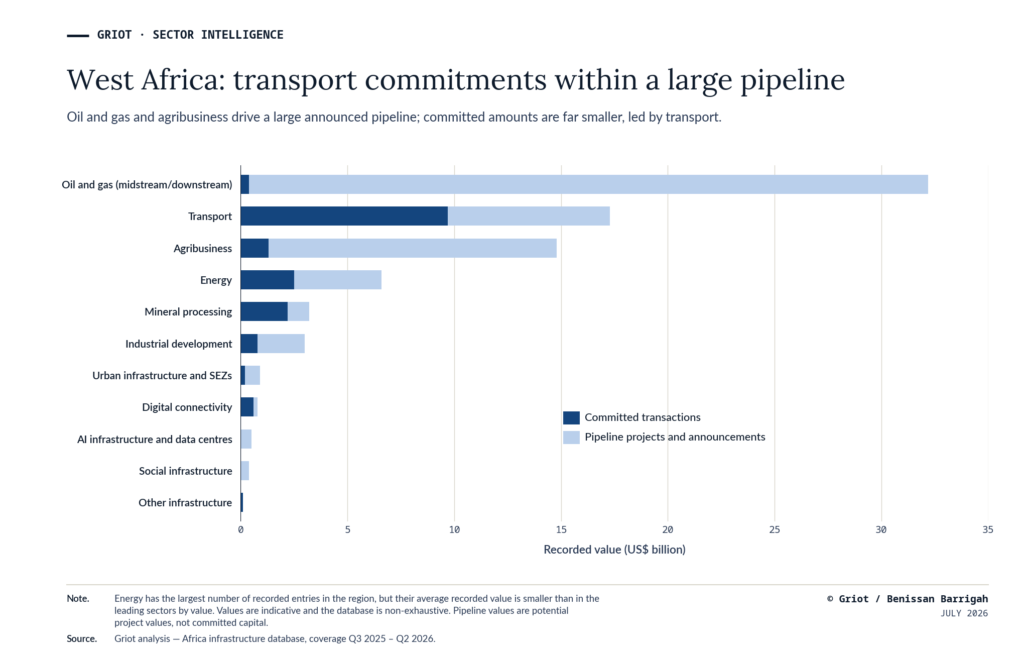
Productive transformation is also prominent in the pipeline. Agribusiness projects aim to expand processing capacity and improve market access. Mining projects place greater emphasis on local value addition.
West Africa’s trajectory will depend on converting this dense project base into a more consistent flow of financed and completed transactions. Joint project preparation and guarantee mechanisms adapted to cross-border assets can support that shift.
Investor landscape
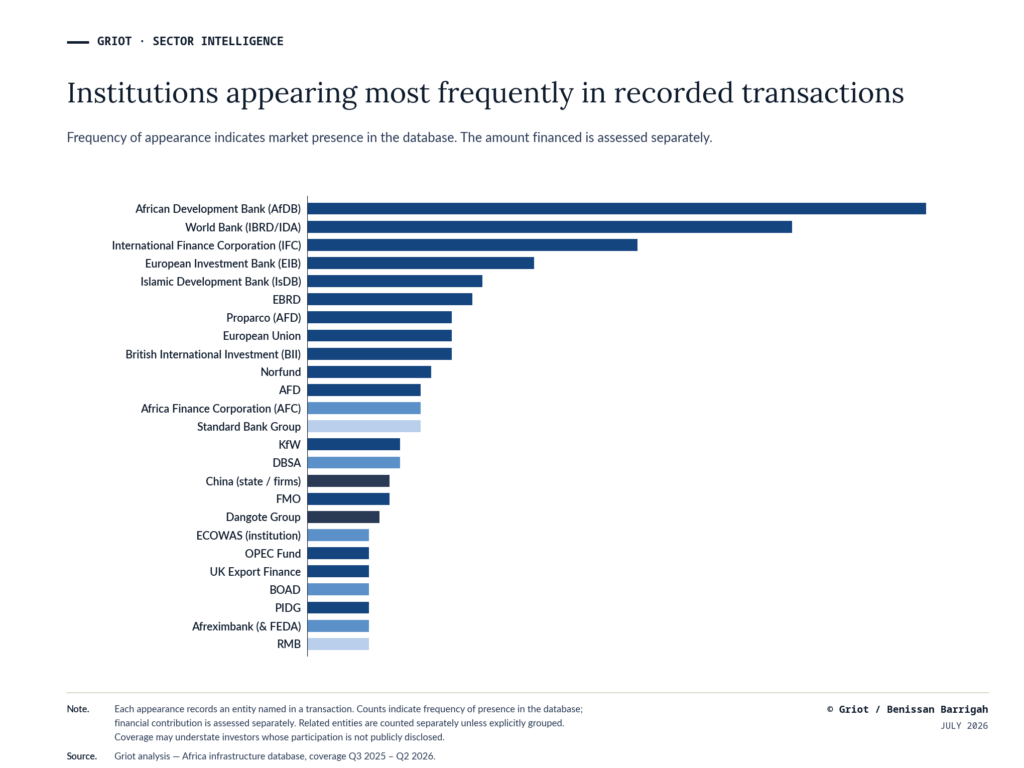
The investor analysis separates participation in a transaction from the amount actually financed, providing a clearer view of market depth.
Governments shape the market through several distinct roles. They set policy and project mandates, and may launch programmes or assume project-related debt. They also structure some PPPs and provide public support. Their principal contribution is to establish the conditions under which transactions can proceed; direct financing represents one element of that role.
Development finance institutions are the most prominent transaction-structuring institutions in the observable market. The African Development Bank and the World Bank Group appear most frequently, followed by other multilateral and bilateral institutions. Their role extends beyond direct financing. They support project preparation and enhance transaction credibility. Guarantees can then attract additional investors.
African financial institutions provide more targeted support and frequently anchor regional or trade-related transactions. Afreximbank, BOAD, AFC and DBSA are the most visible examples. Their knowledge of African markets supports transaction structuring and can help mobilise local capital.
Commercial banks are most visible in the deepest markets, particularly Southern Africa. They provide local-currency financing and carry out the commercial banking functions required to close transactions. Infrastructure and private equity funds appear less frequently, although they can supply long-term equity and refinance operating assets.
African institutional capital is still only lightly visible at project level. Africa50 IAF and AIIM show how it can reach infrastructure through specialised funds. This indirect presence reflects constraints in investment structuring and data traceability despite the underlying pool of domestic resources.
Syndication remains limited
Recurring co-investment relationships are rare in the database. Among 401 observed investor pairs, only 15 appear together in at least two transactions. Repeat collaboration is concentrated among development finance institutions and public funders. Mega-projects often rely on consortia assembled for a single transaction.
Large transactions therefore tend to require a new financing structure each time. Greater use of standing platforms or financing clubs could allow investors to work together across several projects.
Bankability and investor participation vary by sector
Investor participation varies widely by sector. Energy has the most developed financing ecosystem, with regular involvement from DFIs and commercial banks. Private developers also account for a substantial share of recorded activity.
Agribusiness draws mainly on DFIs and specialised funds, often through smaller transactions. Transport relies more heavily on sovereign financing and guarantees, especially for cross-border projects.
Water and social infrastructure depend largely on public or concessional resources. Data centres and industrial assets are more often financed by their sponsors, with limited participation from long-term investors.
Financial depth varies across regions
Southern Africa has the most diversified investor base, although activity remains concentrated in South Africa. DFIs operate alongside commercial banks and specialised funds.
DFIs are dominant in West Africa, with additional participation from regional banks and Islamic finance institutions. In East Africa, private investment remains concentrated in a small number of markets.
North Africa records large values around a narrower group of actors, often linked to major public projects or large corporate groups. Central Africa has the thinnest coverage in the database and relies mainly on DFIs.
Regional financial depth depends on investors that can participate across multiple transactions and on financing structures that can be reused across projects.
From bankability to development capacity
The observable market for African infrastructure is active and supports transactions of considerable scale. Development finance institutions remain prominent, alongside private sponsors and regional financiers. Financing remains fragmented, however. Many large projects still rely on structures assembled for a single transaction, while recurring syndication across projects is limited.
Bankability depends as much on available capital as on the institutional environment surrounding a project. Governments shape it by creating the conditions for predictable revenues and credible risk allocation, backed where necessary by reliable payment commitments and targeted public support. Their ability to sustain these conditions over time is central to translating public priorities into investable projects.
At a broader level, this is a question of financial sovereignty. It concerns the ability of African institutions to determine infrastructure priorities and shape the terms on which public and external capital are combined. DFIs and international investors will remain important in structuring complex transactions and mitigating selected risks. Their contribution has greater lasting value when it strengthens African institutions and expands domestic and regional financing capacity.
Long-term African capital is fundamental to this architecture. Specialised funds and investment vehicles can channel resources held by pension funds, insurers, sovereign wealth funds and public development banks into infrastructure on terms aligned with their mandates and risk tolerances. Local-currency instruments and guarantees can widen participation, while project aggregation and the refinancing of operational assets can help release resources for new investment.
The significance of this architecture lies in the capabilities and opportunities it creates for people and places. Africa’s demographic trajectory gives the issue greater urgency. Whether population growth translates into stronger skills and higher productivity will depend partly on the quality of infrastructure and public services. Deferred investment weakens human capital and constrains economic activity, while much of the resulting cost remains outside conventional financial models.
The limited presence of social infrastructure in the observable market shows that transaction data captures only part of infrastructure’s development value. These assets generate benefits extending well beyond their direct revenues. Public institutions must account for these wider returns when setting priorities and designing financing mechanisms.
Narrowing the financing gap requires a fuller account of what infrastructure makes possible and of the costs created by its absence. Financing choices determine where opportunity takes root and how development is experienced across communities and territories. The projects made financeable today will influence Africa’s economic future and the possibilities open to the generations that follow.